
[Work Log] FIRE - first clustering test
Run #1:
Description: Run initial model estimation on real data for the first time.
Results:
Single cluster:
0.00000000e+00  0.00000000e+00
8.73210306e-03  6.75372609e-02  3.38471516e-02
1.88790755e+00 -1.88387427e+01 -9.88494611e+00
-8.09450747e-01 -2.56388154e-01 -3.61218358e-01 -4.23137123e-02  1.64628674e-02 -1.02962552e-02 -3.82633520e-01
-5.26954930e+01 -9.01436620e+00 -2.14090141e+01  1.88492958e+00  6.61450704e+00  8.49971831e+00 -2.38576056e+01
24.6497
Multiple cluster:
num_clusters:3
log weights: 0 0 0
cluster #1
  0.00000000e+00  0.00000000e+00
 -2.68876589e-01 -7.04390256e-02  1.45450526e-02
  6.16258430e+03  6.13067965e+03  6.12930057e+03
 -1.08771413e-02  5.76005556e-04 -1.04761899e-02 -1.69093096e-03  9.36991863e-04 -3.78348959e-04  1.27422332e-03
 -4.89152880e+01 -9.21454922e+00 -1.77681544e+01  2.47259001e+00  6.28886806e+00  8.63120843e+00 -2.43004449e+01
26.2893
cluster #2
  0.00000000e+00  0.00000000e+00
  1.20215477e-01  0.00000000e+00  2.24383835e-01
  6.11014579e+03  0.00000000e+00  5.96700128e+03
 -1.08771413e-02  5.76005556e-04 -1.04761899e-02 -1.69093096e-03  9.36991863e-04 -3.78348959e-04  1.27422332e-03
 -4.89152880e+01 -9.21454922e+00 -1.77681544e+01  2.47259001e+00  6.28886806e+00  8.63120843e+00 -2.43004449e+01
26.2893
cluster #3
  0.00000000e+00  0.00000000e+00
 -1.52115349e-01  2.77516102e+00  1.82492585e+00
 -3.84569849e+00 -7.18131761e+02 -1.63056790e+02
 -1.08771413e-02  5.76005556e-04 -1.04761899e-02 -1.69093096e-03  9.36991863e-04 -3.78348959e-04  1.27422332e-03
 -4.89152880e+01 -9.21454922e+00 -1.77681544e+01  2.47259001e+00  6.28886806e+00  8.63120843e+00 -2.43004449e+01
26.2893
Discussion
Surprisingly high epsilon (~26). This is far beyond the dynamic range of the data, suggesting either (a) a bug, (b) a terrible model, or (c) failure of the analytical estimation method to find a good result. Option (a) seems more likely, since a flat line give a lower error variance than this. Perhaps our observation basis A was poorly estimated. Lets re-run with PCA method.
Run #2: PCA method
Description: Re-run but using PCA instead of regression to estimate observation transformation, A. (i.e. change constant use_regression_method to false).
Results:
Single cluster:
  0.00000000e+00  0.00000000e+00
  8.73210306e-03  6.75372609e-02  3.38471516e-02
  1.88790755e+00 -1.88387427e+01 -9.88494611e+00
 -8.09450747e-01 -2.56388154e-01 -3.61218358e-01 -4.23137123e-02  1.64628674e-02 -1.02962552e-02 -3.82633520e-01
 -5.26954930e+01 -9.01436620e+00 -2.14090141e+01  1.88492958e+00  6.61450704e+00  8.49971831e+00 -2.38576056e+01
24.6497
Multiple Cluster
num_clusters:3
log weights: 0 0 0
cluster #1
  0.00000000e+00  0.00000000e+00
  1.13041314e-02  6.75372609e-02  3.41203573e-02
  3.56421036e-01 -1.88387427e+01 -1.11922319e+01
 -8.09450747e-01 -2.56388154e-01 -3.61218358e-01 -4.23137123e-02  1.64628674e-02 -1.02962552e-02 -3.82633520e-01
 -5.26954930e+01 -9.01436620e+00 -2.14090141e+01  1.88492958e+00  6.61450704e+00  8.49971831e+00 -2.38576056e+01
24.6497
cluster #2
  0.00000000e+00  0.00000000e+00
  1.05708618e-03  0.00000000e+00  0.00000000e+00
  5.35534897e+01  0.00000000e+00  0.00000000e+00
 -8.09450747e-01 -2.56388154e-01 -3.61218358e-01 -4.23137123e-02  1.64628674e-02 -1.02962552e-02 -3.82633520e-01
 -5.26954930e+01 -9.01436620e+00 -2.14090141e+01  1.88492958e+00  6.61450704e+00  8.49971831e+00 -2.38576056e+01
24.6497
cluster #3
  0.00000000e+00  0.00000000e+00
  0.00000000e+00  0.00000000e+00  3.06188063e-02
  1.18920520e+02  0.00000000e+00  7.71079754e+01
 -8.09450747e-01 -2.56388154e-01 -3.61218358e-01 -4.23137123e-02  1.64628674e-02 -1.02962552e-02 -3.82633520e-01
 -5.26954930e+01 -9.01436620e+00 -2.14090141e+01  1.88492958e+00  6.61450704e+00  8.49971831e+00 -2.38576056e+01
24.6497
Discussion
No noticable improvement. During K-means, cluster collapse was frequent, which didn't occur in previous run.
Immunity data inspection
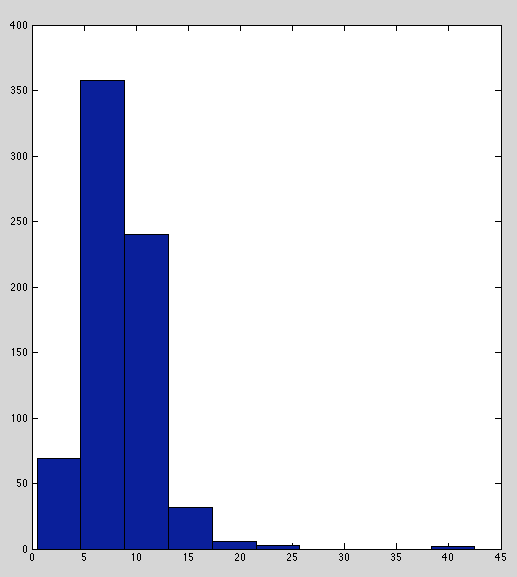
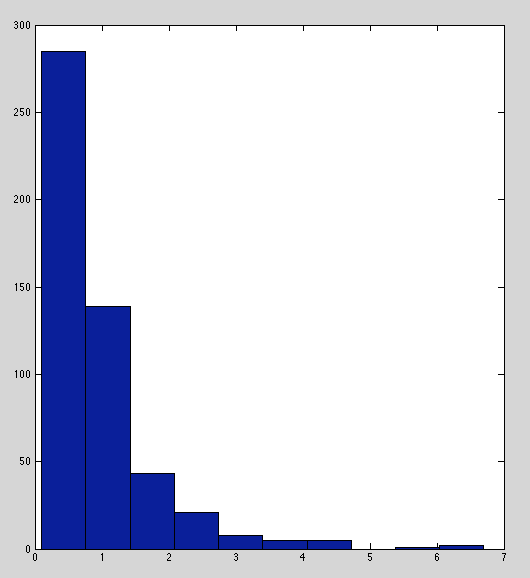
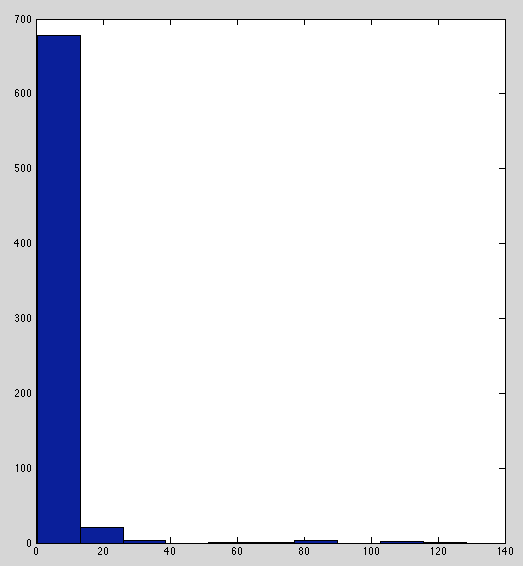
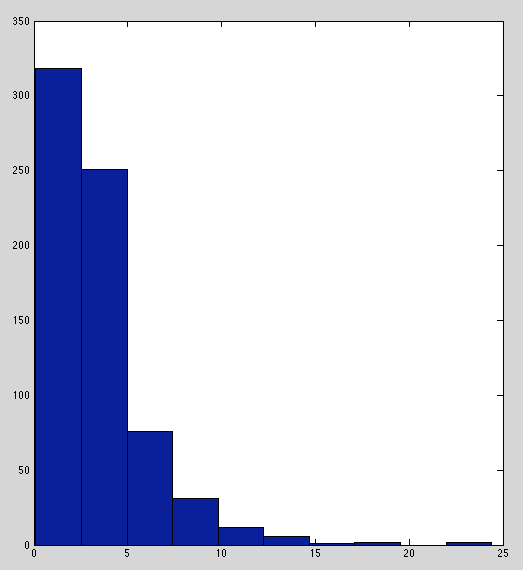
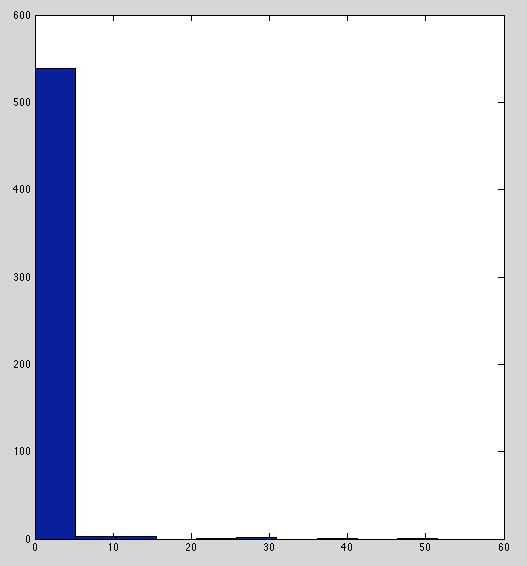
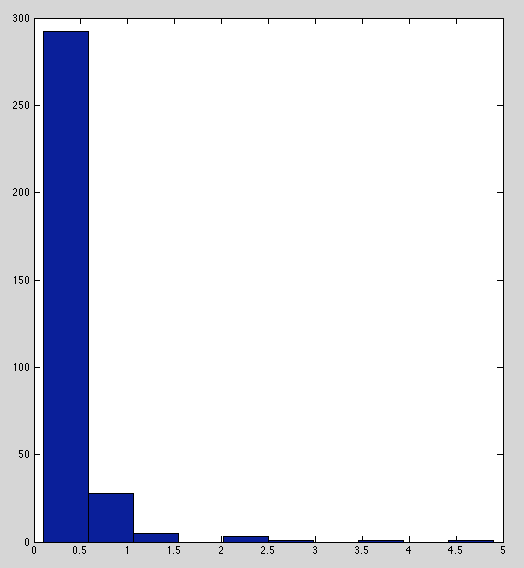
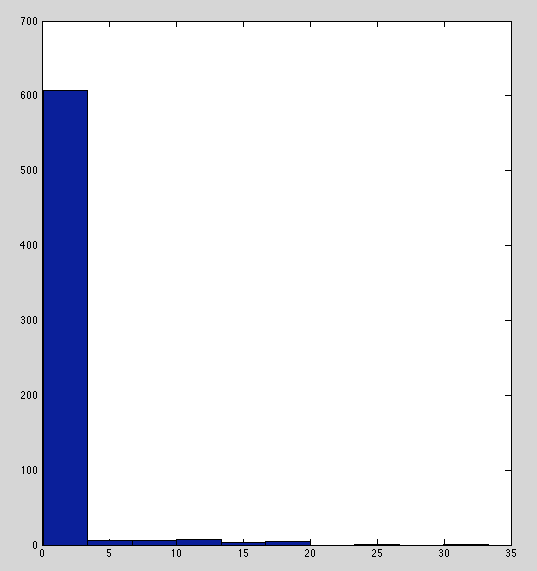
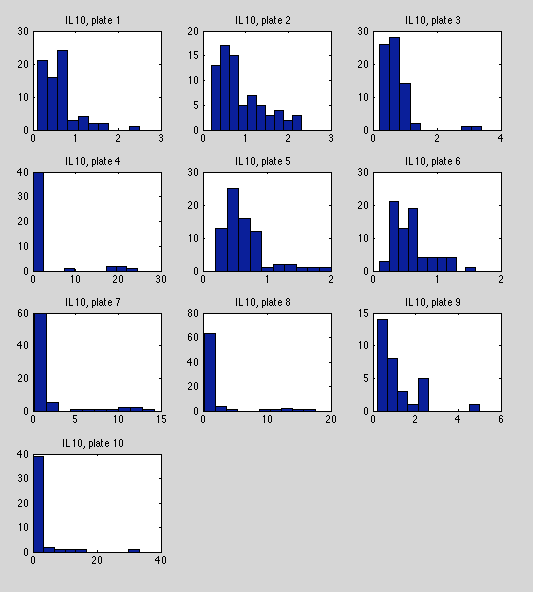
Below are histograms of raw immunity readings for each marker. TNF-α, IL-2, and IL-6 have sensible distributions.
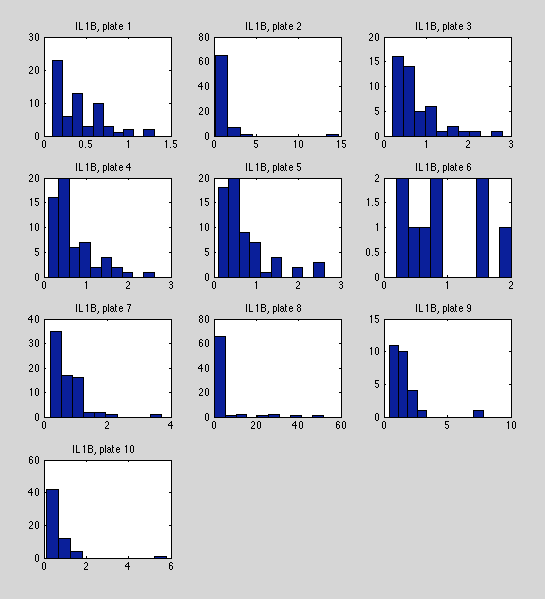
IL-1b and IL-10 have weirdly peaked distribution with heavy tails. Perhaps outliers are isolated to specific plates (investigated next).
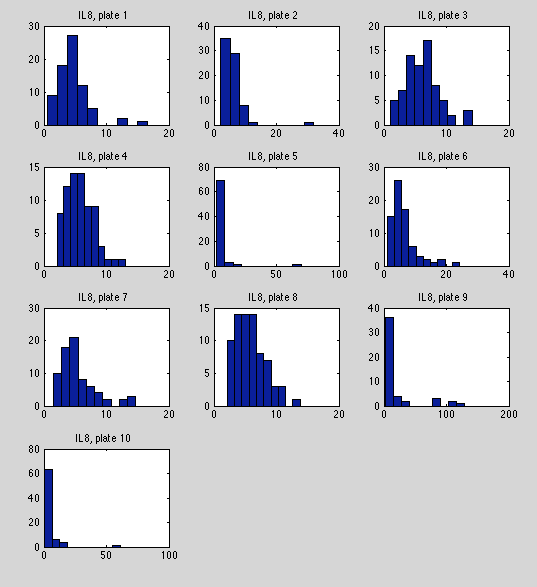
IFN and IL-8 are borderline; peaked with heavy tails but not as bad as IL-1b and IL-10.
Per-plate distributions.
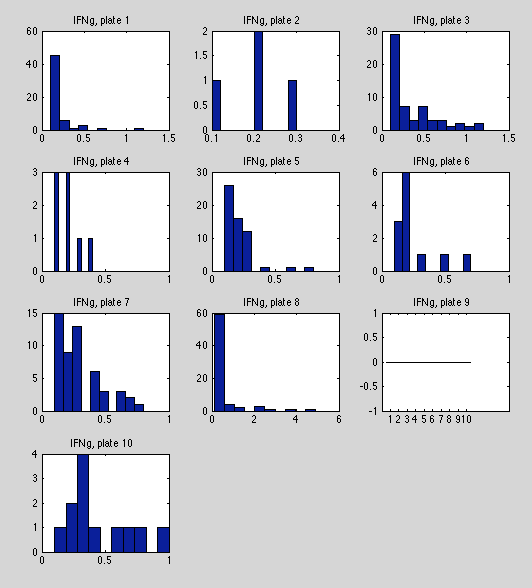
One of the worse plates in terms of missing/out-of-range data (331/710). Irregular distributions, and plate 9 has no radings within range.
Another reasonably strong variable in terms of missing data (637/710). Plots seem somewhat irregular, but possibly due to excessible outliers in plates 10, 7, 8, 4. This could be good support for a clustering model if it would explain the heavy tails in these plates
In terms of missing data, this variable is borderline (550/710). Plates seem to split between (a) seemingly exponential-distrubted data (2,3,4,7,8, 10), and (b) irregular data (plates 1,5,6,9). I'm doubtful that this will be useful for inference.
Note massive variation in support between plates. e.g. plate 8 maxes out at 80, while plate 1 stops at 1.3.
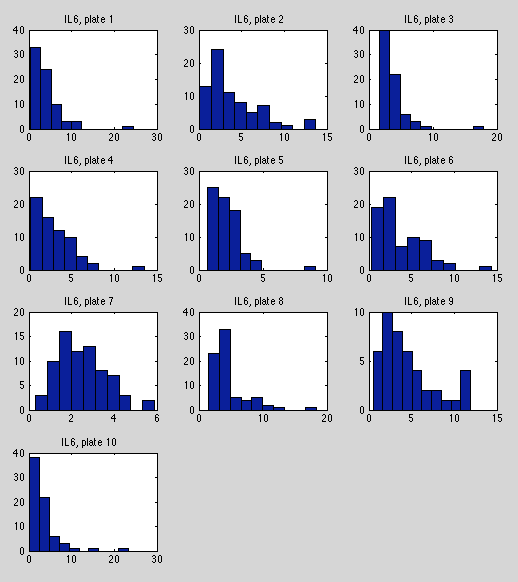
Very little missing data in this dataset (699/710). Seems much more consistent than most other datasets. Scale and shape vary a bit, but not glaring inconsistencies, aside from a few outliers (e.g. plate 9).
Lots of between-plate variability (plate 7 vs. 10).
Seems to be Gamma-distributed or log-normal distributed but with lots of big outliers. Plates 5 and 10 have extreme outliers
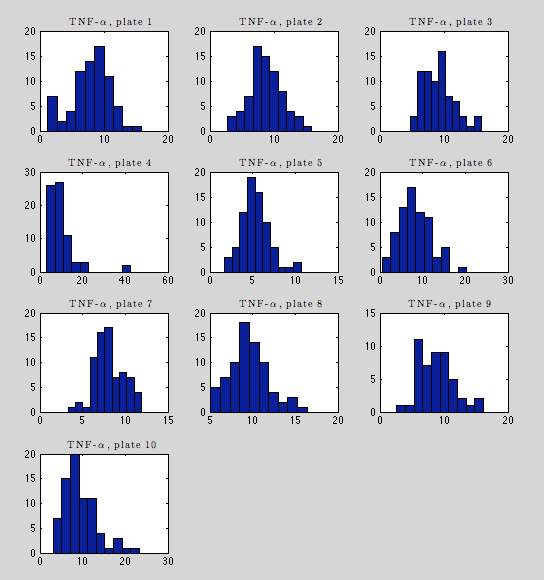
The best plate in terms of missing data (710/710), TNF-α seems very regular within-plates. Note the strong gaussian shapes here, compared to the full-dataset histogram earlier.
Variation between plates is notable (see plate 5 vs. plate 8). Supports a regularization approach.
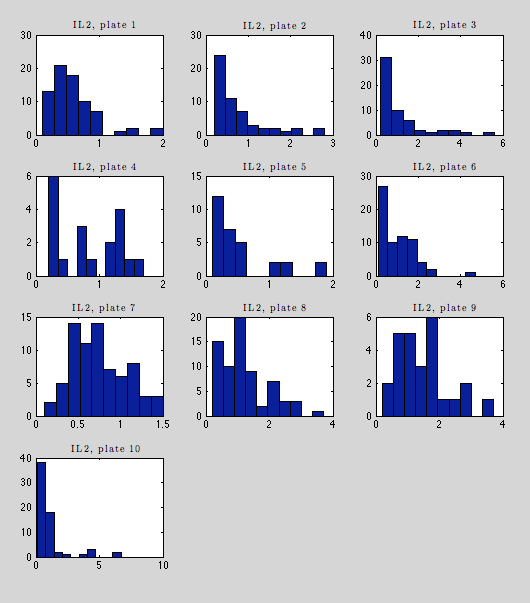
This is one of the stronger plates in terms of missing data (710/710 present). Several plates have decent gaussian distributions, albeit with heavy tails (1, 7, 9), but several are irregular (4, 5, 8, 9), and others look more exponential (2, 3, 10).