
[Reference] FIRE immunity plots
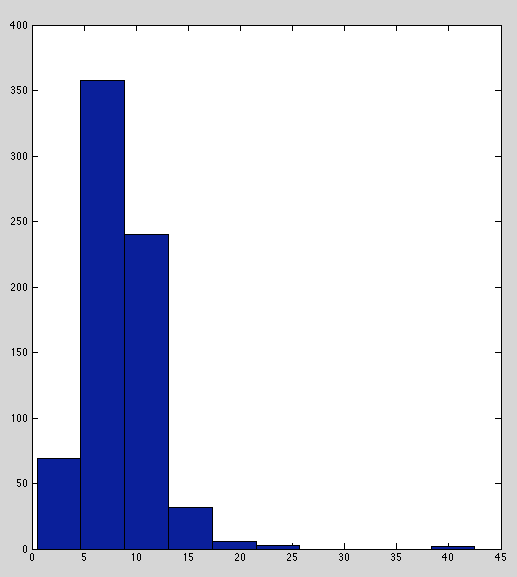
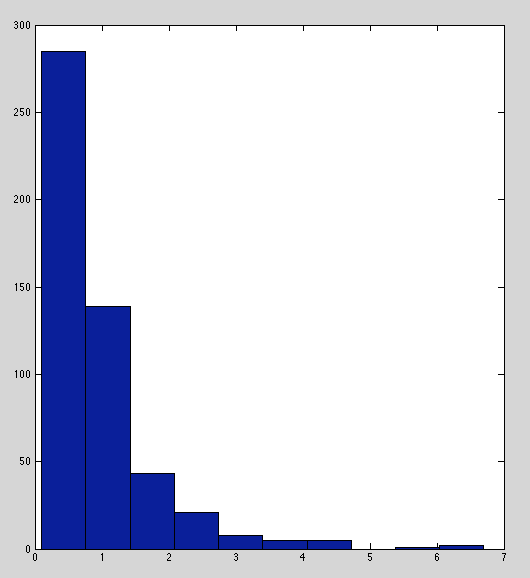
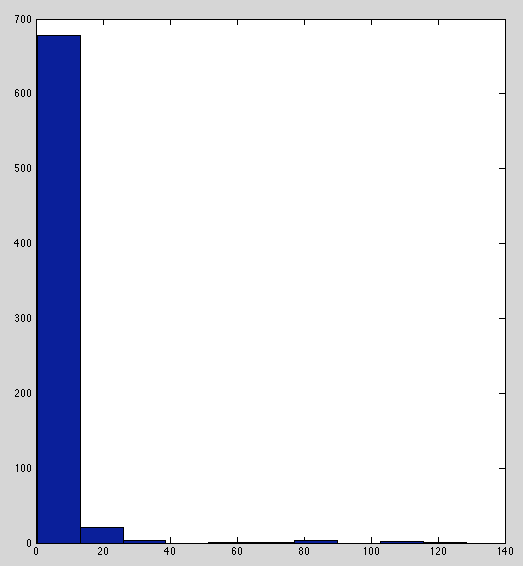
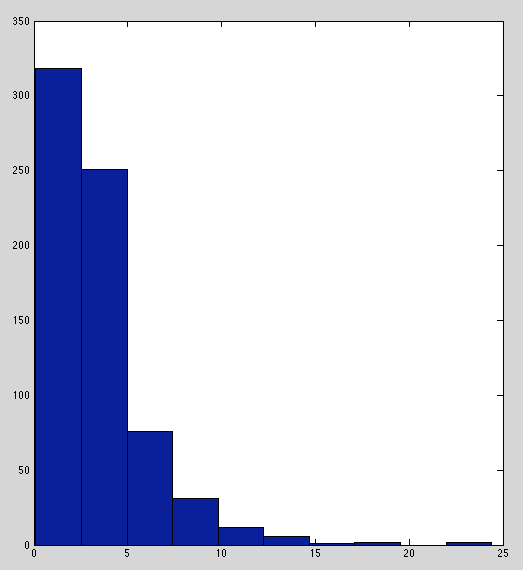
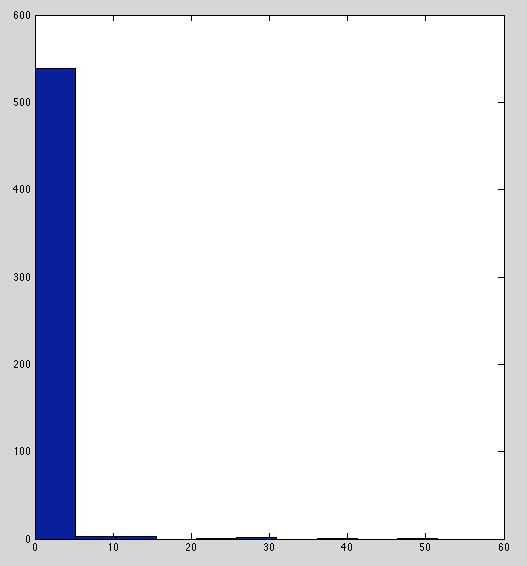
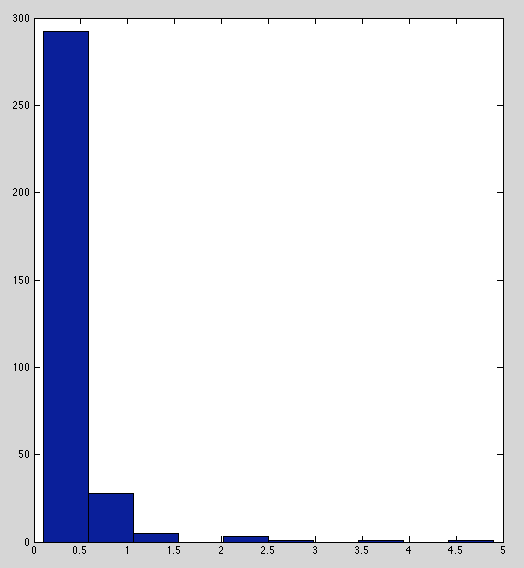
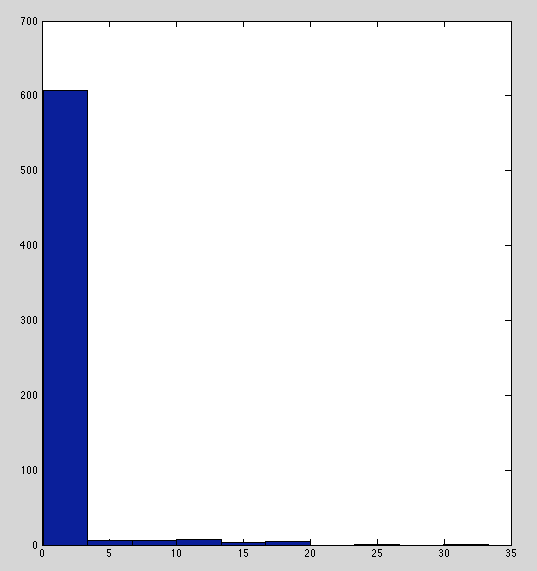
Below are histograms of raw immunity readings for each marker.
Aside from TNF-α, IL-2, and IL-6, distributions are very peaked and heavy-tailed. Specific-plate histograms (shown later) reveal more detail.
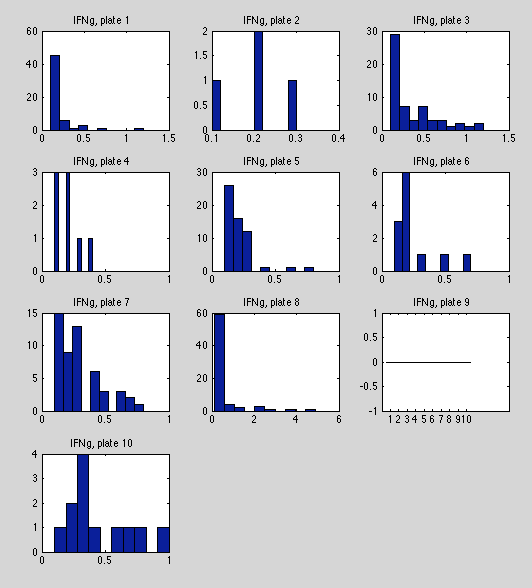
Per-plate distributions.
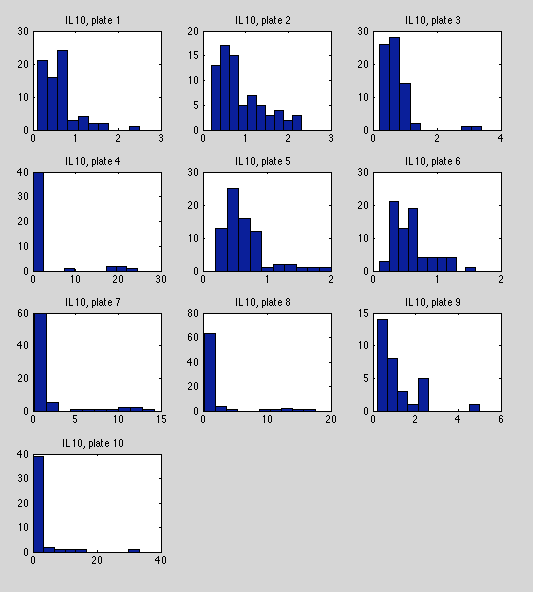
Below are per-plate histograms of immunity readings, broken into plates. Compared to the full-popuation histograms above, signfiicant regularity emerges in these plots, esp. in TNF-α, IL-8, IL-10.
One of the worse plates in terms of missing/unreadable data (331/710). Irregular between and within plates.
Another reasonably strong variable in terms of missing data (637/710). Plots seem somewhat irregular, but possibly due to excessible outliers in plates 10, 7, 8, 4. This could be a good argument for a clustering/mixture model, as it might explain the heavy tails in the aforementioned plates.
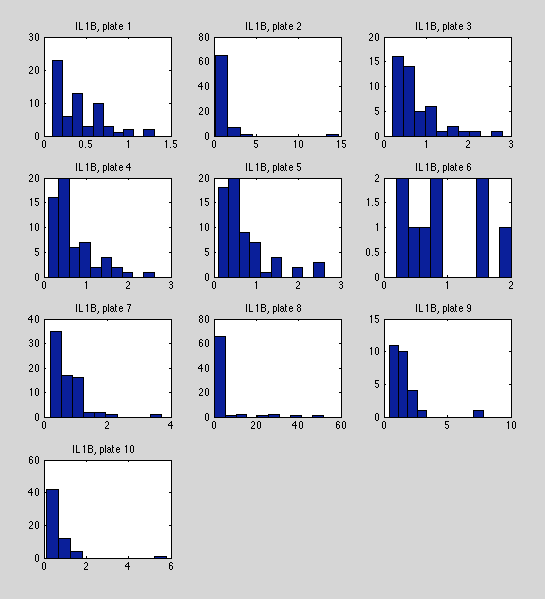
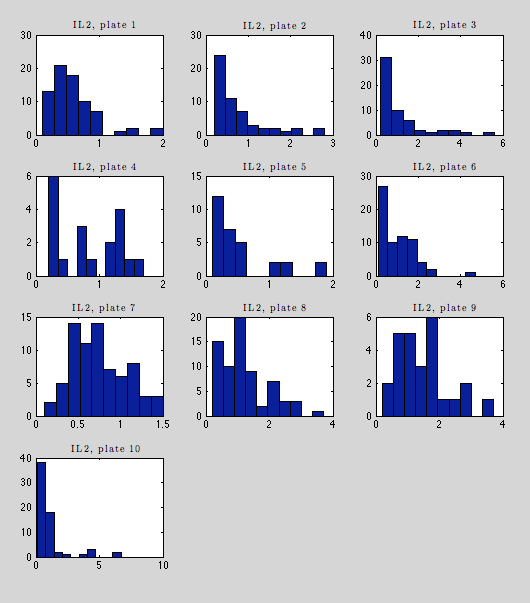
In terms of missing data, this variable is borderline (550/710). Plates seem to split between (a) seemingly exponential-distrubted data (2,3,4,7,8, 10), and (b) irregular data (plates 1,5,6,9). This could pose problems for our inference efforts.
Note massive variation between plates. e.g. plate 8 has a maximum at 60, while plate 1 stops at 1.3.
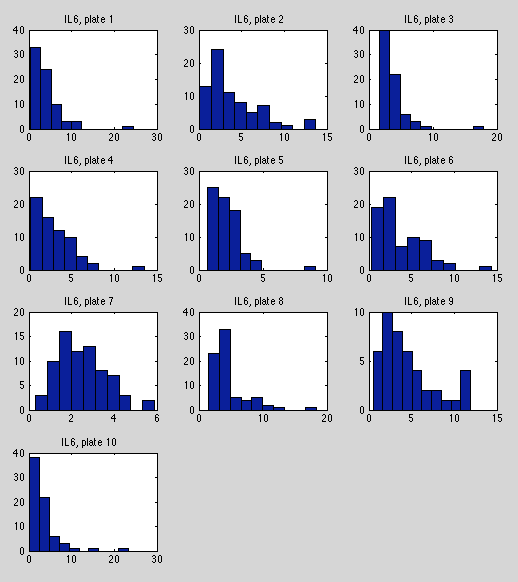
Very little missing data in this variable (699/710 observed). Seems much more consistent than most other datasets. Scale and shape vary a bit, but no glaring inconsistencies, aside from a few outliers (e.g. plate 9).
Lots of between-plate variability (e.g. plate 7 vs. 10).
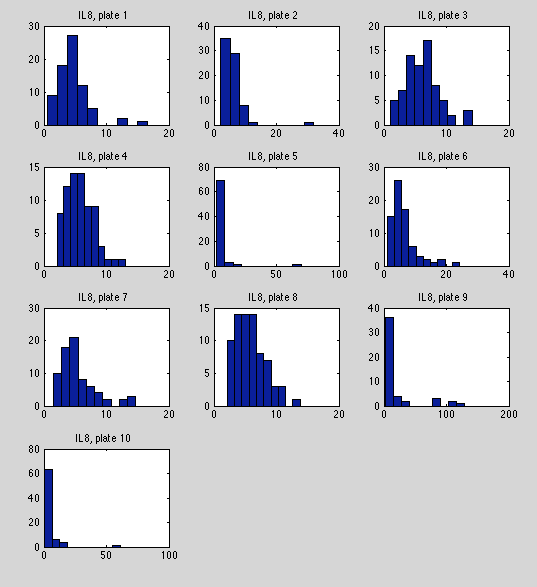
An excellent variable in terms of missing data (710 of 710 readings within range). The results seem very regular compared to other variables. Seems to be Gamma-distributed or log-normal distributed but some big outliers. Plates 5 and 10 have extreme outliers
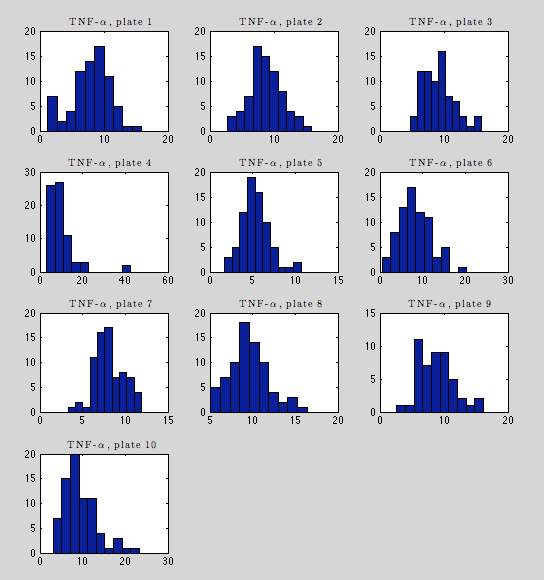
The best plate in terms of missing data (710/710), TNF-α seems very regular within-plates. Note the strong gaussian shapes here, compared to the full-dataset histogram earlier.
Variation between plates is notable (see plate 5 vs. plate 8). Supports a regularization approach.
This is one of the strongest plates in terms of missing data (710 of 710 observed). Several plates have decent gaussian distributions, albeit with heavy tails (1, 7, 9), but several are irregular (4, 5, 8, 9), and others look more exponential (2, 3, 10).