
[Work Log] Work Log - Uninformative likelihood?
Likelihood sanity check (ctd)
An empty model should have a significantly worse likelihood than the ground truth model.
ground truth model:  -3.38064e+08
empty model: -3.28279e+08
full model: -1.20572e+08
Both empty and full are better than ground truth. Why??
At least possiblities here:
- Noise level is so high that fitting is impossible (remember the paper "Fundamental limits of Bayesian Inference: Order Parameters and Phase Transitions for Road Tracking")
- Bug. maybe renderings are just waaaay off?
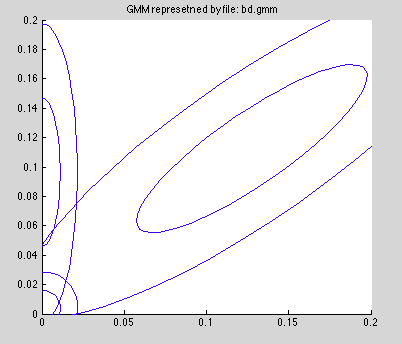
- Bad calibration. Looking at the GMM plot from yesterday (see below) it looks like the one-sigma contour is very very large.
Case 1 is what's left over once 2 and 3 are ruled out.
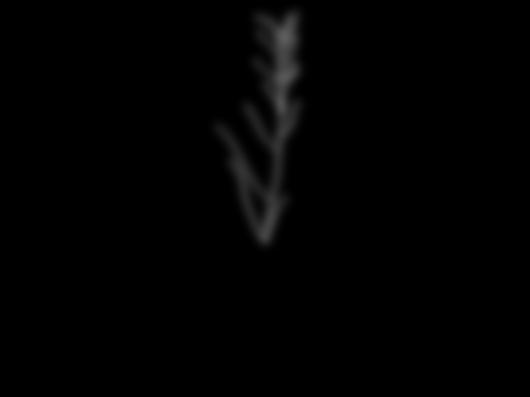
Rendering sanity check.
This seems to be a culprit.
Here's first data view:
Not a good match to the actual first data image:
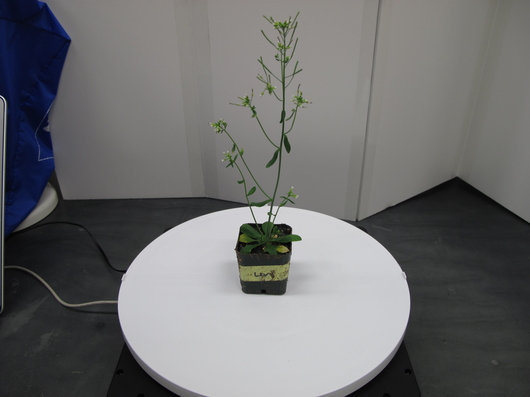
But a good match to the second data image:
Must be an off-by-one error when reading data.
The cameras are not off-by one. Here's the rendering of the model under the first camera:
Good match to the first data image above.
Bug is in the config file:
view-indices=1:4:36  # bug here
view-indices=0:4:35  # should be this
Good news, bad news.
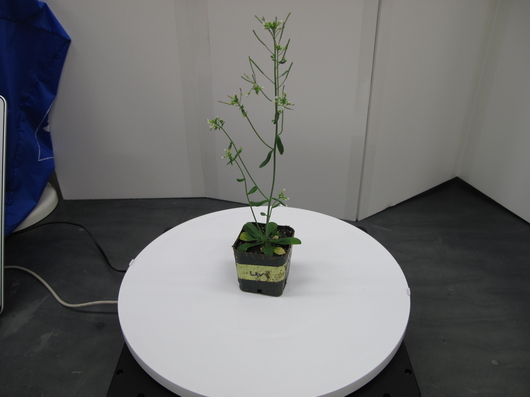
Good news: after fixing config file, data and rendering look good (use slider to swap between images)
Bad news: likelihood gets worse!
fixed likelhood: -3.38298e+08
It looks like the rendered model is lighter than the data model. This might account for the issues we're seeing. We're in the region to the right of the diagonal "true positive" component in the GMM (see contour plot above). In this region, the noise model has a stronger pull than the true positive model, which partially explains why we get better when fewer model pixels are on the screen. It doesn't explain why the model gets better when we shift left and right -- maybe it fits better in the tails of the blurred data, but we'd expect it to eventually get worse. Lets test it.
Recall that this GMM was trained on a manipulated version of the data image, not a rendered 3D model image. The process taken was (a) removing all background pixels from the data image and (b) perturbing the foreground pixels. We may have removed a few foreground pixels to add false positives, but the amount was small, if memory serves. Now we have far fewer model pixels, so we expect the "true positive" region to be slanted more upward.
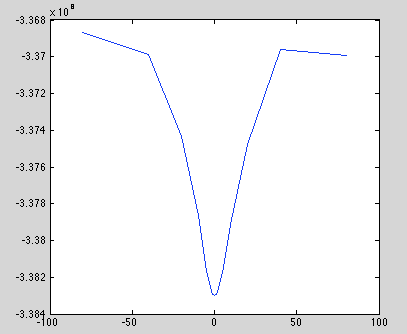
Optimality test (redux)
Code: x_values="-80 -40 -20 -10 -5 -2 -1 0 1 2 5 10 20 40 80" for x in $x_values; do echo -n "$x "; ./likelihood_server \ --config=test.conf \ --image-bounds "0 530 397 0 200 2000" \ --cam-convention "1 0 0" \ --dbg_save_frames \ --dbg_load_message \ --dbg-ppo-x-offset=$x 2> /dev/null | grep ^3 | sed -e 's/3 //' -e 's/,//'; done
Output (delta-x vs log-likelihood):
-80 -3.36866e+08
-40 -3.36987e+08
-20 -3.37434e+08
-10 -3.37864e+08
-5 -3.38169e+08
-2 -3.38279e+08
-1 -3.38294e+08
0 -3.38298e+08
1 -3.38292e+08
2 -3.38275e+08
5 -3.38172e+08
10 -3.37912e+08
20 -3.37479e+08
40 -3.36958e+08
80 -3.36991e+08
Plot:
"Full" model issue
One of the strangest things is the fact that a rendering full of "1.0's" performs far better than the ground truth or empty model. This area lies along the x-axis in the GMM contour plot, where there is no support.
Lets debug this.
Found an insane bug. Below is the loop that compares all the pixels of the data and rendered model:
    for(size_t i = 0; i <= size_; ++i)
    {
        kjb::Vector2 x;
        x[0] = model[i];
        x[1] = data_[i] + 1;

        ...  // compute p(x[1] | x[0])
    }
I have no idea why we're adding 1.0 to data_[i], but this explains everything. In the "full" model, it puts us right on the diagonal of the GMM. In the empty model, we're right on the x-axis. Both are well-supported regions. In the ground truth model, we're lying between these extremes, which is a no-man's land of near-zero support.
Spending 5 minutes to determine how this got added...
...
It was added between November 11 and December 13 last year. No obvious reason. Oh well.
New sanity check numbers:
full model -5.2217e+08
ground truth model 4.03273e+06
empty model: 4.01252e+06
Much more sensible. Missing data looks terrible, noise looks okay but not great, ground truth looks best. Lets do an offset plot just to be safe.
Optimality test (redux2)
Results: -80 3.1039e+06 -40 3.27557e+06 -20 3.58156e+06 -10 3.77333e+06 -5 3.93159e+06 -2 4.01459e+06 -1 4.02845e+06 0 4.03273e+06 1 4.02704e+06 2 4.01209e+06 5 3.93021e+06 10 3.78782e+06 20 3.60557e+06 40 3.26585e+06 80 3.26894e+06
Plot
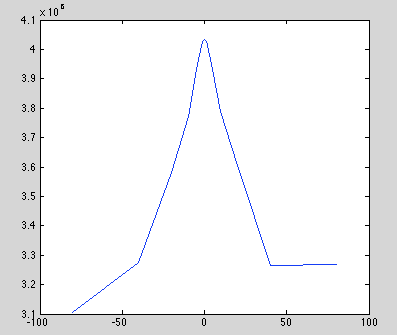
Oh Yeah!!
BD Likelihood Data Dump Mode.
add a mode by which pixel likelihood will save pixel data to files for analysis or debugging
changes will appear in:
- lib/evaluate/bd_likelihood.h - Bd_pixel_likelihood_cpu
- lib/evaluate/bd_likelihood.h - Bd_mv_likeliood_cpu
- ./likelihood_server.cpp - Options
- ./likelihood_server.cpp - main()
Added dump mode. Probably should move this into a separate directory, or at least a different program, since it has almost nothing to do with the likleihood server.
TODO
- rename matlab "render_client" code to "likelihood_client"
- increase spacing between reconstructed points
- remove edges around image border.
- get this running on cuda server
- train likelihood
Open issues
- how to sync datasets on matlab and c++ server?
- Wacv multi-view reconstruction for training
- saving wacv to files for training
- fixing issues in wacv reconstructions
- evaluation methodology
- split/merge