
[Work Log] Singular Regions Issue; Training
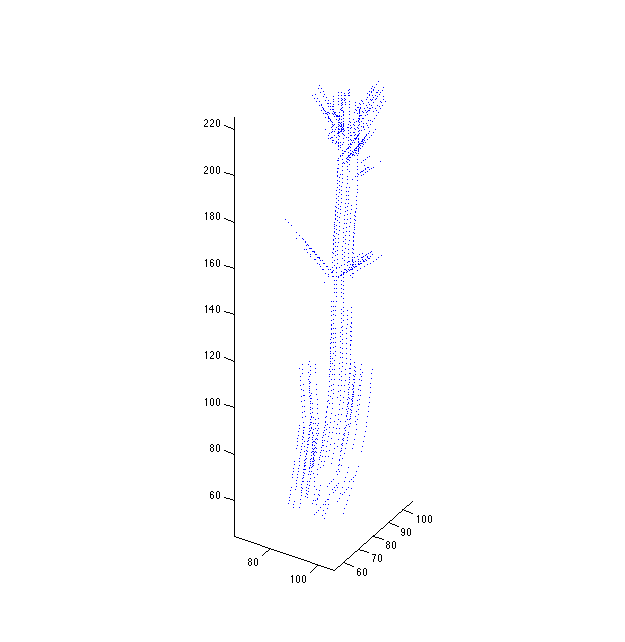
Investigating the "Spreading" issue with increases to perturb_rate_variance.
...
Confirmed the same phenomenon with increase to perturb_position_variance.
Setting perturb_position_variance to 1000:
Setting perturb_position_variance to 1000000:
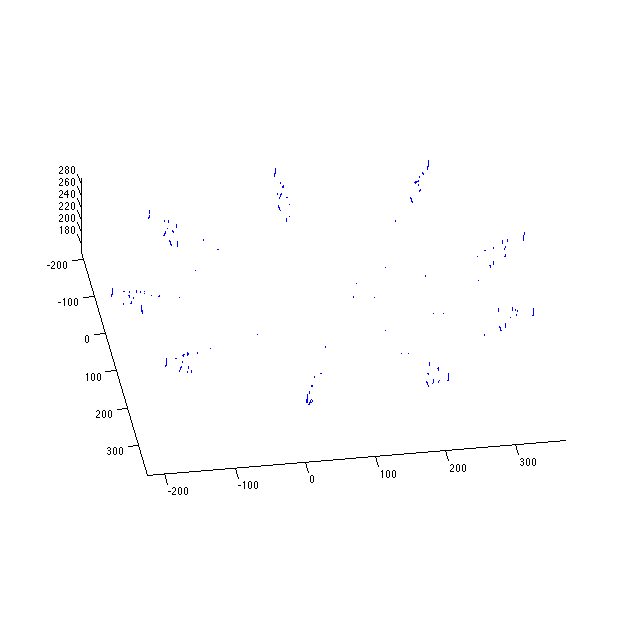
Spreading appears to increase monotonically with perturb_position_variance.
Again, this is surprising, because you'd expect them to revert to the maximum likelihood solution.
...
However, recall that the per-view likelihood has infinite variance in the back-projection direction. The spreading appears to be occuring in this direction. The infinite variance means that any influence from the prior will overcome the likelihood.
But isn't the prior centered at zero? Why is the result drifting so far from zero?
...
One thing is clear: with high perturb* values, the correlation between nearby views becomes negligible compared to the within-view variance. And since the likelihood variance has an infinite component, the posterior variance grows with perturb*. While we can inspect the maximum posterior curve, it is relatively meaningless because the variance is so great.
Even so, why doesn't it just revert to the mean?
Mean rate is zero, but it can't be exactly zero, because the likelihood requires that the curve be near the data. But the data's position is only known in two dimensions, so the posterior is free to manipulate the third dimension so that the rate is minimized.
...
Model is trying to use a linear-perturbation model to explain per-view deviations from the mean model. Since the deviations don't arise from pure scaling, it has to contort into bizarre shapes to explain it.
But the bizarre shapes fit the data better, so it's worth it.
"Singular Regions"
GOT IT! Recall that the likelihood variance is measured in world units, even though they are really image-based values. As the curve moves toward the camera, the likelihood variance should ideally reduce, since the same size of world perturbations result in larger image perturbations. But in our model they don't, and so curves can stray farther from the data in the image, but still look nearby the data according to the Gaussian.
In the extreme case, all the points end up near the camera pinhole, and they will be in the center of the data Gaussian. In practice, any point within \(\sigma2\) of the camera will be well supported, where \(\sigma2\) is the average noise variance in 3D. I'll call this the "Singular Region", where all the of likelihood's Gaussian "cylinders" (degenerate cones) intersect and overlap.
In terms of the marginal likelihood, this can cause counterintuitive behavior. For example, large perturb_rate_variance might be good, because it allows the curve to wander into the "singular zone" near the camera. Thinking of in spherical coordinates, there is a wedge of the sphere that points toward the camera, and as the perturb_rate_variance increases, this wedge remains relatively constant in angular size, but gets longer and longer. The longer it gets, the more of singular zone it overlaps. Even though greater variance means there are more possible model configurations, there is a period during which the proportion of these configurations that are well-supported by the likelihood doesn't necessarily decrease, so the ML doesn't necessarily decrease, either.
This explains the phenomenon we saw during training, where the plot of ML vs. perturb_rate_variance (reproduced below).
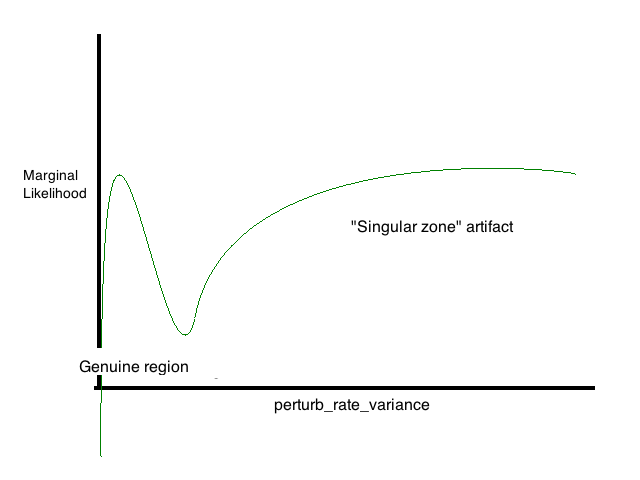
The lump to the left is the result of the singular region giving false support near the camera.
...
Need to somehow place penalty for any point that strays too far from the mean curve. Can this be done without radically distorting the model?
What if I placed a limit on the likelihood variance, instead of letting it be infinite? It will prevent the prior of taking credit for lousy configurations during the ML marginalization.
Experiments
Modified train/tr_construct_matrices.m to clamp the likelihood's maximum variance to some multiple of the largest finite eigenvalue (see local function "fix_precisions"). ML shouldn't change much when using reasonable values.
Results:
Reference (no cap): 2.2675e+04  (inf)
100x cap:           2.2109e+04  (1.2 mm)
1000x cap:          2.2360e+04  (3.8 mm)
10000x cap:         2.2510e+04  (12 mm)
100000x cap:        2.2596e+04  (38 mm)
1000000x cap:       2.2654e+04  (12 cm)
Capping the variance to 10000x the triangulation variance results in a standard deviation of about 12mm in practice, which seems very reasonable.
We have to raise standard deviation to 12 cm for it to be accurate to three significant digits, which seems somewhat high. Possibly, even with reasonable model parameters, we're still seeing some influence from the "singular zone," so it may be a good thing that we aren't seeing the full reference value.
Training Results
Running training using clamped likelihoods.
No Perturb Model Model: smoothing_variance: 0.0025 noise_variance: 0.1231 position_variance: 1.6658e+04 rate_variance: 0.2207
Final ML: 2.371 x 10^4
Exactly the same result as the non-clamped version.
Ind Perturb Model Model: smoothing_variance: 0.0019 noise_variance: 0.0719 position_variance: 1.6729e+04 rate_variance: 0.2422 perturb_smoothing_variance: 3.3860e-41 perturb_rate_variance: 1.4918e-06 perturb_position_variance: 0.4801
Final ML: 2.512 x 10^4
Old non-clamped training resulted in perturb_rate_variance exploding. The new perturb_rate_variance looks very reasonable.
OU Perturb Model
Model:
        smoothing_variance: 0.0019
            noise_variance: 0.0721
         position_variance: 1.6681e+04
             rate_variance: 0.2146
perturb_smoothing_variance: 3.3860e-41
     perturb_rate_variance: 1.4711e-06
 perturb_position_variance: 0.7793
             perturb_scale: 3.7353

Final ML:  2.516 x 10^4
Some of the global variance is can be pushed into the perturb_variance, since they are now correlated.
SQEXP Perturb Model
Model:
        smoothing_variance: 0.0018
            noise_variance: 0.0720
         position_variance: 1.6689e+04
             rate_variance: 0.2122
perturb_smoothing_variance: 3.3860e-41
     perturb_rate_variance: 1.4952e-06
 perturb_position_variance: 0.5130
             perturb_scale: 0.8425

Final ML: 2.516 x 10^4
General observations
It's still somewhat weird that perturb_smoothing_variance is so low. I'm pretty sure there are non-negligible deformations occurring during the imaging process. Maybe it's just the Ind-perturb model? More likely it's because the curves that deform are reversed...
...
Which of the perturb-components are really correlated? Seems like position variance is probably independent, but rate variance might not be. Definitely smoothing_variance (i.e. nonrigid deformations) should be correlated.
TODO
- try visualization with truncated likelihoods
- does increasing rate variance eventually have no effect?
- remove perturb_scale from ind model (better inference)
- hand-pick parameters and fix them, to reduce dimensionality of search space.
- Handle "flipped" curves. Try to infer direction
- Does the visualized max posterior look good for the trained values (I'm guessing not -- too strict of variances, overfitting)