
[Work Log] Training Bugs
Continuing training of OU perturb model.
Yesterday, we had problems with the perturb scale exploding. Have switched to using a logistic sigmoid instead of an exponential to map perturb_scale, which sets a lower-bound and and upper-bound during optimization.
...
perturb_scale is now staying low, but stil getting weird results.
perturb_position_variance wants to be 9000+ ???
perturb_rate_variance wants to be ~40?
perturb_smoothing_variance wants to be ~0.0.
...
Trying new kernel: ind_kernel. Like OU and SQEXP kernels, but no correlation between perturbations. It's an intermediate step between no-perturb and ou-perturb, since it allows perturbations, but doesn't need a scale-length parameter.
Training results for ind_kernel:
train_params_3 =

            smoothing_variance: 0.0024
                noise_variance: 0.0132
             position_variance: 1.5747e+04
                 rate_variance: 0.1709
    perturb_smoothing_variance: 0.0020
         perturb_rate_variance: 26.3458
     perturb_position_variance: 0.8770
                 perturb_scale: 1.7199
Very weird that perturb_rate variance
Consider limiting number of dimensions somehow...
- Force both smoothing_variances to be the same
- remove perturb_scale parameter
- ???
....
recall that handling view-index in kernels has never been thoroughly tested...
...
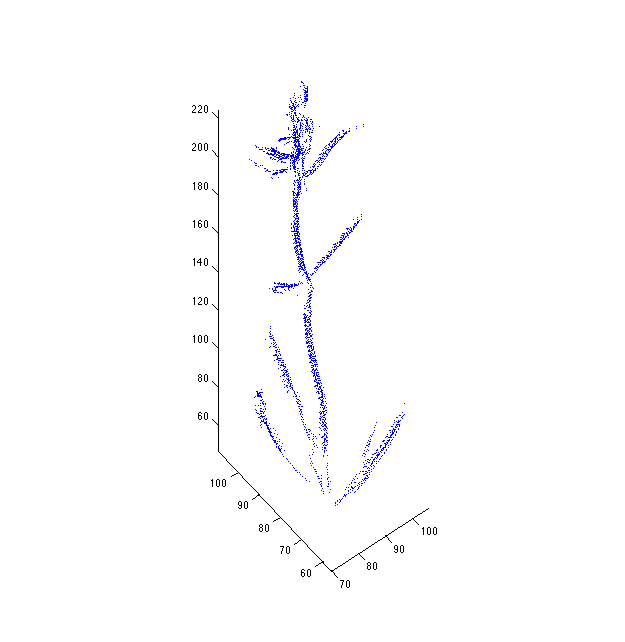
Let's visualize results for the ind_perturb model, and see if everything looks reasonable.
Created test/tmp_visualize_test.m.
...
Interesting... Some curves are "reversed", i.e. the base is the "end" of the curve and the tip is the "beginning". This has some unintended consequences when applying the perturb model, because the tips are where perturbations are greatest, but when curves are reversed, the tips aren't affected by most of the modelled perturbations.
...
Weird. As perturb_rate_variance increases, the per-view curves spread out radially like flower petals.
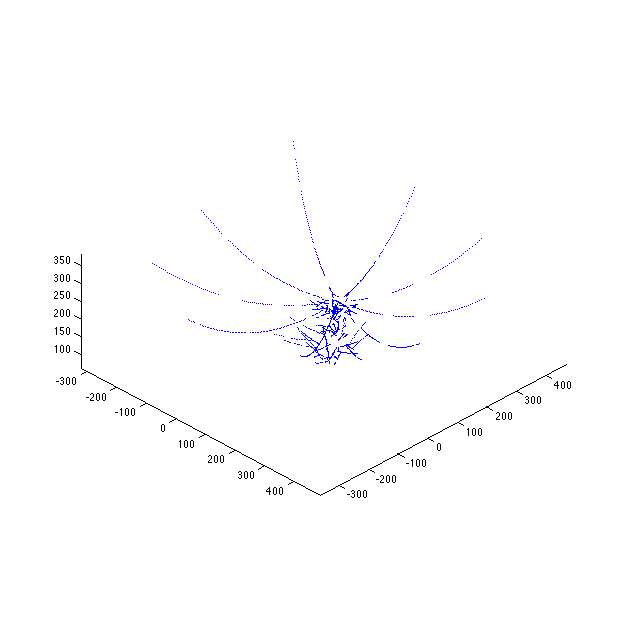
I would have expected that the likelihood would take over, but this is clearly not happening. Lets look at the likelihood...
We must be running up against numerical precision errors. Let's look at the equation for maximum posterior:
When Σ0 has huge eigenvalues, this equation basically reduces to
However, the effective cancellation of \Sigma_0 can't occur, because the expression (Σ0Σ−1l+I) has a huge condition number, which makes inverting it an unstable operation.
...
Anyways, that's visualization. Is the same issue arising in ML computations? Higher rate variance can result in significantly larger condition numbers, and IIRC, we don't take any special steps to handle such issues in the ML computation anymore (for example, using the matrix inversion lemma).
Maybe we should force rate variance to be within a reasonable range.
...
Even when perturb_rate_variance is reasonable (1.0), we still get drifting:
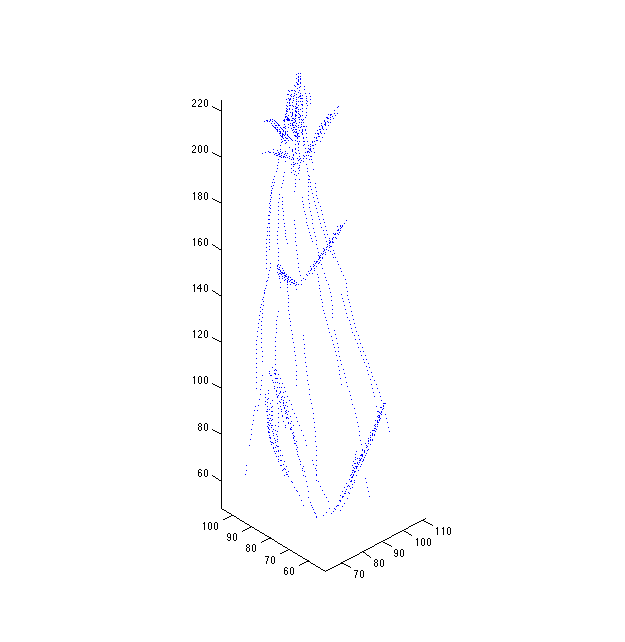
The degree of this phenomenon seems to be a smooth function of perturb_rate_variance. If it was a numerical instability issue, we'd see it arise abruptly, indicating we had entered the unstable regime.
I'm now thinking this is a real issue with the model, not simply an artifact of computation (maybe it's both?). Need to think more about it.
TODO
- Determine why spreading happens when
perturb_rate_varianceincreases. - Determine why huge
perturb_rate_variancevalues are promoted by the ML. - Handle "reversed curves" issue, where perturbation is applied to the wrong end.
- Training
- Finish "ind" model
- Traing "ou" and "sqexp" models