
[Work Log] Visualizing/Debugging BG ML
June 12, 2013
Experiment
We now have a new algorithm for computing background curve Marginal Likelihood. Lowering noise sigma σn should rule out bad matches.
Task: Re-run background candidate matching with new algorithm and roughly-trained σn.
Results
If the threshold is set right, the results are improved, but we still have some false-positives and false negatives.
It's still unclear whether we can get good results without thresholding, since we haven't computed the noise ML using the new algorithm, so absolute numbers are meaningless.
Params:
smoothing_variance_2d: 0.2500
    noise_variance_2d: 10
     position_mean_2d: [2x1 double]
 position_variance_2d: 1.3629e+04
     rate_variance_2d: 0.4962
   smoothing_variance: 1.0000e-04
       noise_variance: 10
        position_mean: [3x1 double]
    position_variance: 62500
        rate_variance: 2.2500
      smoothing_sigma: 0.2000
       nlise_variance: 10
    noise_variance_bg: 0.1038
Calls:
data = offline_pair_candidates(data, params, 0, 1, 1, 'bg');
cands = tmp_get_cands(data);
visualize_bg_cands(data, cands, 250)
Plots
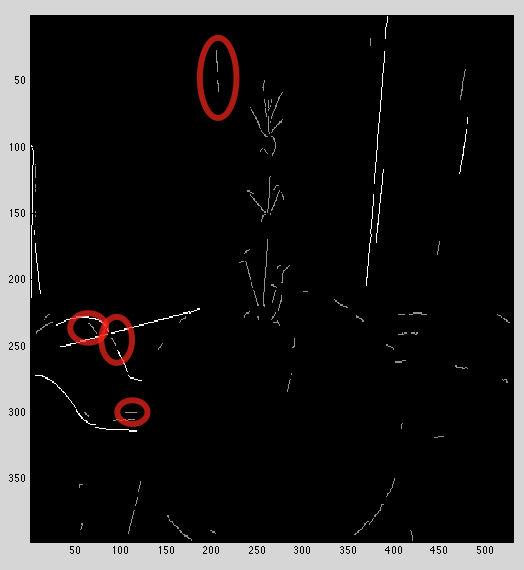
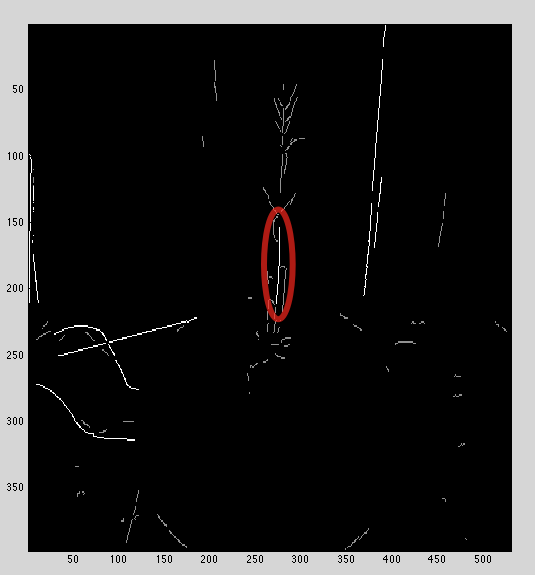
Matched curves appear in white, unmatched appear in gray
False negatives
False positives:
Next Steps
- apply new indexing and cleanup algorithm to 3d and noise curves
- better training of foreground/background
- ground truth curve fragments
- automatic training of background
- automatic training of noise
- better foreground model
- compute likelihood separately
- add smooth GP to likelihood
- re-run experiment with trained noise model parameters