
[Work Log] Problems with WACV Ground-truth reconstruction; Disasterous results with Split/merge toy problem
Have some problems with offline correspondence pair_matching.
Is it a bug introduced in the reconstruction code? Lots of refactors there, recently.
Test by re-running wacv results.
WACV Reconstruction (revisited)
Now that datasets six through eleven have been re-ground-truthed, should confirm them by running wacv reconstruction code on them. Also this should confirm whether we've introduced any reconstruction bugs in the last week or two.
Problem with dataset six: curve #4 isn't connected to its parent.
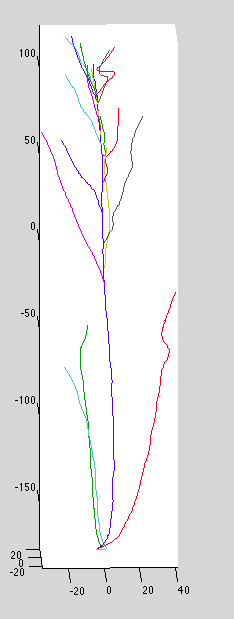
Problem with dataset 1: really crooked. Inspecting the ground-truth doesn't show any obvious problems that would cause this. Maybe reversed curves? (which should be handled, but maybe aren't)
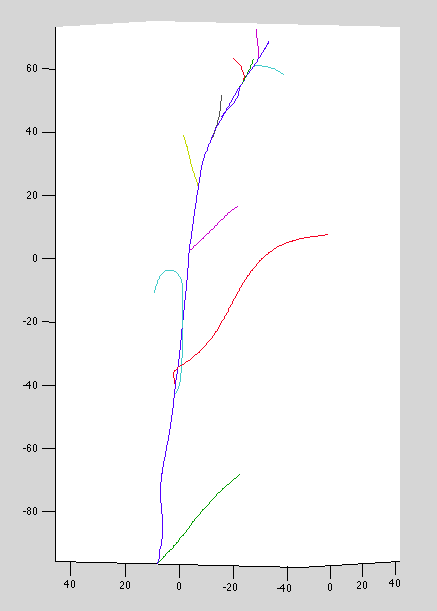
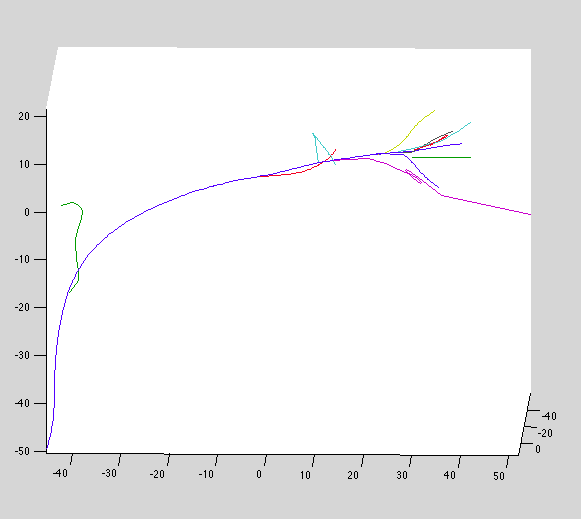
Dataset 6: base curve attaches from wrong side (red curve below):
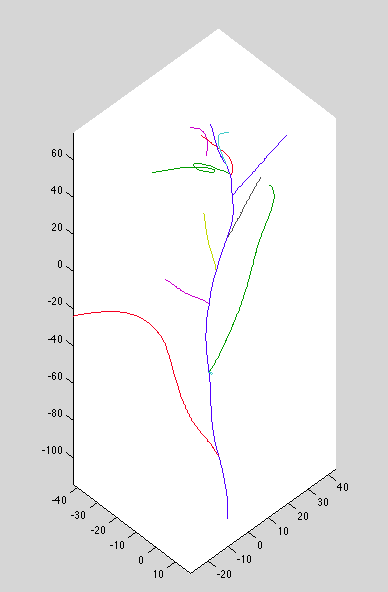
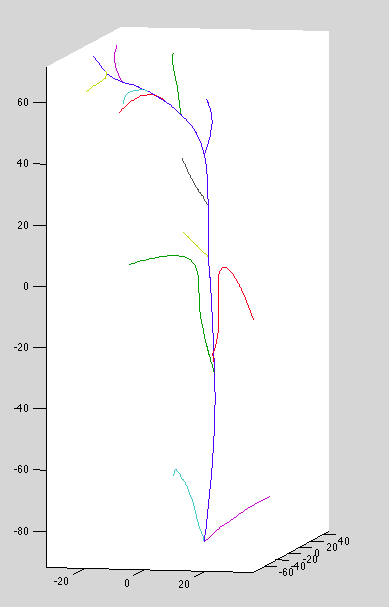
Dataset 7: Wacky top curves, missing connections at top, no base curves:
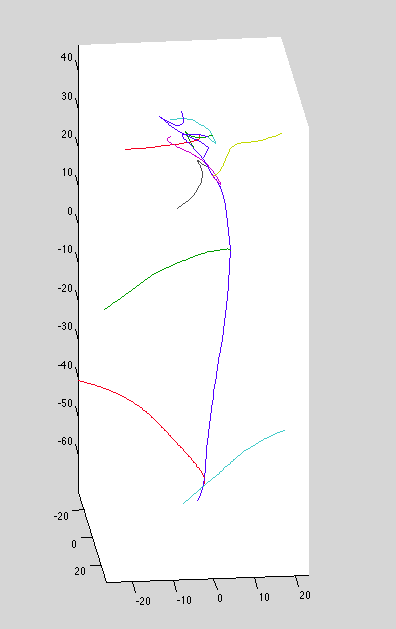
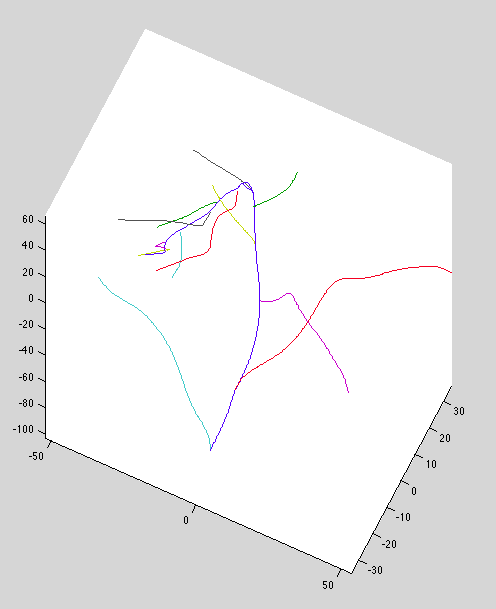
Dataset 8: missed connections, bad top curves
Dataset 9: problems...
Datset 10: Good!
Datset 11: Bad top-curve associations
Revenge of the Pre-curves
When investigating issues from dataset 6, discovered that results improved when ensuring that lateral curves don't go past the parent curve. For example
   |   /      |   /     |   /
   |  /       |  /      |  /
   | /        |_/      _|_/
   |          |         |
   |          |         |
   |          |         |
 Good       Best       Bad
Priors and proposal distributions
Thinking about split proposal distributions.
I've been thinking about the combinitorics of partitions and realized I'v been counting wrong. Given M curves and N observations, I was counting the number of partitions as \(MN\). This doesn't account for the fact that order of cluster id's doesn't matter, so a better count would be \(MN / N! \), which divides by the number of permutations of the cluster id's. However, this is still wrong, because it counts assignments with empty clusters (which is indistinquishible from a model with N-1 clusters. The real number of partitions is given by Stirling numbers of the second kind.
The same goes for the partitioning that occurs during a split move.
Implemented tools/build_stirling2.m, which builds an NxN matrix of the log of Stirling numbers of the second kind.
Want to know that probability of accepting a merge move in various configurations, assuming the likelihood is constant. Here's the test code:
% number of observations: 918
% number of tracks: n
% number of observations in track i: k_i

p_merged  = @(n,k) -sm(918,n-1);
p_split = @(n,k) -sm(918,n);
q_split = @(n,k) log(1/(n-1)) - sm(k, 2);
q_merge = @(n,k) -log(nchoosek(n, 2));
alpha = @(n,k) p_merged(n,k) - p_split(n,k) + q_split(n,k) - q_merge(n,k);
Running in several scenarios from plant-modelling problem:
% small number of curves; L,M,S number of observations
>> alpha(5, 50)

ans =

  169.0363

>> alpha(5, 20)

ans =

  189.8307

>>  alpha(5, 5)

ans =

  200.2747

% medium number of curves; L,M,S number of observations
>> alpha(10, 50)

ans =

   60.8395

>> alpha(10, 20)

ans =

   81.6339

>> alpha(10, 5)

ans =

   92.0779

% huge number of curves; L,M,S number of observations
>> alpha(100, 50)

ans =

  -26.7355

>> alpha(100, 20)

ans =

   -5.9411

>> alpha(100, 5)

ans =

    4.5029
Update: These numbers are slightly off, due to a bug in the stirling number computation (now fixed). The resulting alphas aren't substantially different.
In most realistic-model scenarios, the probability of accepting a merge move (ignoring the likelihood; assuming constant) is 100% (i.e. positive alpha).
When the number of curves is huge (e.g. early in the sampler, when we need merges the most), the probability of acceptance is non-negligible only if the number of observations in the resulting curve is relatively small. This is usually the case, and continuously merging short curves will result the acceptance probability getting larger and larger.
It is interesting that in the presence of a constant likelihood, the sampler would ever prever fewer tracks to more.
In these cases, the sampler is preferring to split up curves with abnormally large number of observations (compared to other pertitions).
Would it be interesting to sample over partitions and see how the partition numbers and sizes evolve over time? Heck yes!
Toy problem: sampling partitions
Prior: Uniform over number of groups. Given a group, uniform over partitions.
Likelihood: uniform. For simplicity, I'd like the sampler's exploration to not be influenced by which split or merge we pick.
We implement a split-merge move. When splitting, a group is picked at random, and its members are randomly split into two groups. On merge, two groups are picked at random and merged.
The prior of a model with N observations and k groups is 1/s(N,k) where s the number of ways to partition N into k groups.
Results
When initialized with a single monolithic group (k=1), the sampler jumps between k=1 and k=2, rejecting about 50% of the time. The sampler never jumps to k=3.
This is a problem, because we'd expect to spend the same amount of time in the k=3 state as any other, since the target distribution is uniform over number of tracks.
Either this is a bug, a flaw in my assumptions, or "simply" a mixing problem (a huge practical issue, but theoretically still correct).
After exhausting myself bug-hunting, I decided to explore the mixing issue.
Instead of initializing to k=1, I initialized to k=3. Both the split and merge move have an acceptance probability of exp(-51.0), meaning it accept once in every 7.1e23 samples. This sampler definitely has bad mixing.
Aside. It seemed notable that the split and merge move had the exact same acceptance probability for k=3. At first this seems sensible, since the sampler should spend as much time in a two-group model as in a four-group. It turns out not to be true for any other k≠3 I tried, but all exhibited poor mixing. In fact, this asymmetry is natural, as the cardinality of the split proposals doesn't grow at exactly the same rate as the cardinality of the data-partitions. This is balanced by the fact that you might transition to a lower model less often than the higher model, but you might spend more time in the lower model once you're there.
Note that although we've used a uniform likelihood, this mixing problem likely can't be fixed by using a different likelihood. The likelihood could drive the sampler in a specific direction, but the reverse direction would be even harder to explore. So the likelihood only makes matters worse.
Q: Can I compute the expected length spent in each state?
A: yes. 1/p_leave, where p_leave = (0.5 * split_alpha + 0.5 * merge_alpha)
Q: Can I compute the expected direction of transition between states? A: yes. split_alpha / (split_alpha + merge_alpha);
Q: Can I compute the expected ratio between an N-group model and an N+1 group model? A: Do MCMC sampling. When you reach a state, add its expected number of rejected samples to its tally, then transition up or down according to the direction distribution.
New toy sampler: Expected ratio between model probabilities
% compute expected samples
% compute up probability
% (state, tallies)
% random walk between states,
TODO
- Fix dataset six: connect curve 4 to parent
- Add confirmation code to check for multiple connected components in ground truth.